iFANN
    ابحث في iFANN...
    تسجيل الدخول
    الرئيسية
    الأخبار
    فيديوهات
    صور
    صور GIF
    استكشاف
    استطلاعات
    الجوائز
    iFAMOUS
    ويكي
    أنمي
    غرف
    الإشعارات
    الرسائل
    المحفوظات
    الملف الشخصي
    ويكيالجوائزiFAMOUSالتصنيفاتالقطاعاتمكافآت المبدعينمكافآت المستخدمينالشروطالخصوصيةإرشادات المجتمعالإزالة / DMCAالمساعدةالمطورون

    © 2026 iFANN

    الرئيسية
    بحث
    الرسائل
    التنبيهات
    الملف الشخصي
    صورة
    Evira
    Evira@evira3mo
    💭Finance💭artificial intelligence
    AI boom investment surge graph

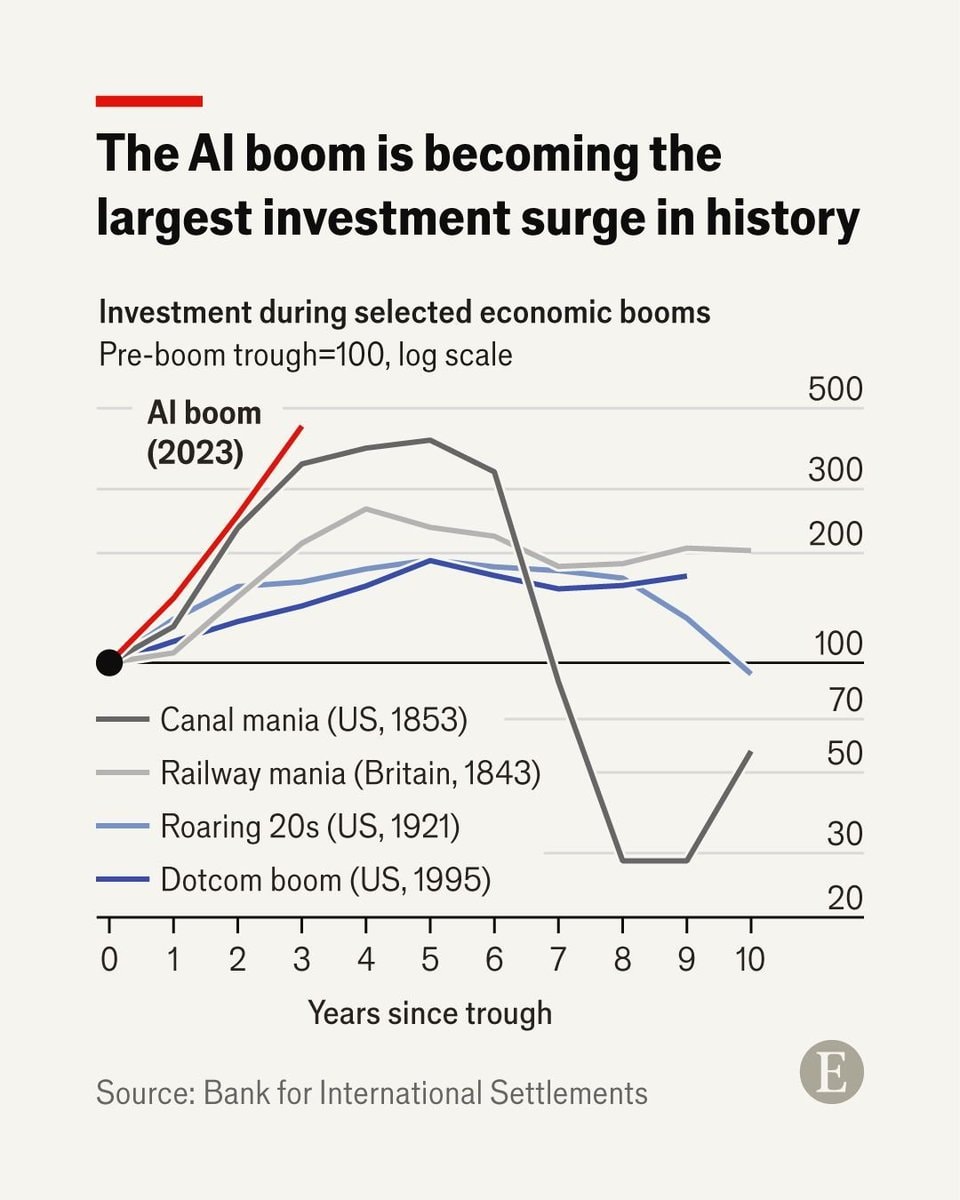
    @eviraInvestment surges have a new heavyweight. The Bank for International Settlements stacked the AI boom against Canal mania, Railway mania, the Roaring 20s, and the Dotcom boom, and the 2023 line already towers over them, and it’s just the beginning

    عرض المنشور الأصلي

    AI boom investment surge graph

    صورة بواسطة @evira· Aug 6, 2026· Finance

    عن هذه الصورة

    The image is a graph illustrating investment during selected economic booms. The focus is on the "AI boom (2023)" shown as a steep red line, compared to historical booms like Canal mania, Railway mania, Roaring 20s, and Dotcom boom. The graph has a clean, informative aesthetic. Visually notable is the sharp upward trajectory of the AI boom line, significantly outperforming the others. ON-SCREEN TEXT: The AI boom is becoming the largest investment surge in history Investment during selected economic booms Pre-boom trough=100, log scale AI boom (2023) Canal mania (US, 1853) Railway mania (Britain, 1843) Roaring 20s (US, 1921) Dotcom boom (US, 1995) Years since trough Source: Bank for International Settlements E

    عرض كل صور Finance

    ?

    لا توجد تعليقات بعد. كن أول من يعلّق!

    المزيد من صور Finance

    عرض كل صور Finance
    Nvidia market value dropNvidia market value dropGoldman Sachs gold forecast 20282Goldman Sachs gold forecast 2028New York Stock Exchange outage2New York Stock Exchange outageChase and Bank of America banking outagesChase and Bank of America banking outagesNvidia stock chart $NVDANvidia stock chart $NVDASydney Sweeney Novig Just Sports4Sydney Sweeney Novig Just SportsGermany living on credit: Bundesrechnungshof debt reportGermany living on credit: Bundesrechnungshof debt reportSeries B debt dashboard end of 2025Series B debt dashboard end of 2025Jensen Huang returns as Nvidia CEO2Jensen Huang returns as Nvidia CEONvidia 10-Q paper gains explainedNvidia 10-Q paper gains explainedBitcoin price movement chartBitcoin price movement chartCrypto longs liquidated $645,000,000Crypto longs liquidated $645,000,000Bitcoin BTC crash under $66,000Bitcoin BTC crash under $66,000Bitcoin U.S. Dollar crash4Bitcoin U.S. Dollar crashBitcoin crash $67,000Bitcoin crash $67,000Kalshi FAA grounding betting marketsKalshi FAA grounding betting markets
    صورة
    Evira
    Evira@evira3mo
    💭Finance💭artificial intelligence
    AI boom investment surge graph

    @eviraInvestment surges have a new heavyweight. The Bank for International Settlements stacked the AI boom against Canal mania, Railway mania, the Roaring 20s, and the Dotcom boom, and the 2023 line already towers over them, and it’s just the beginning

    عرض المنشور الأصلي

    AI boom investment surge graph

    صورة بواسطة @evira· Aug 6, 2026· Finance

    عن هذه الصورة

    The image is a graph illustrating investment during selected economic booms. The focus is on the "AI boom (2023)" shown as a steep red line, compared to historical booms like Canal mania, Railway mania, Roaring 20s, and Dotcom boom. The graph has a clean, informative aesthetic. Visually notable is the sharp upward trajectory of the AI boom line, significantly outperforming the others. ON-SCREEN TEXT: The AI boom is becoming the largest investment surge in history Investment during selected economic booms Pre-boom trough=100, log scale AI boom (2023) Canal mania (US, 1853) Railway mania (Britain, 1843) Roaring 20s (US, 1921) Dotcom boom (US, 1995) Years since trough Source: Bank for International Settlements E

    عرض كل صور Finance

    ?

    لا توجد تعليقات بعد. كن أول من يعلّق!

    المزيد من صور Finance

    عرض كل صور Finance
    Nvidia market value dropNvidia market value dropGoldman Sachs gold forecast 20282Goldman Sachs gold forecast 2028New York Stock Exchange outage2New York Stock Exchange outageChase and Bank of America banking outagesChase and Bank of America banking outagesNvidia stock chart $NVDANvidia stock chart $NVDASydney Sweeney Novig Just Sports4Sydney Sweeney Novig Just SportsGermany living on credit: Bundesrechnungshof debt reportGermany living on credit: Bundesrechnungshof debt reportSeries B debt dashboard end of 2025Series B debt dashboard end of 2025Jensen Huang returns as Nvidia CEO2Jensen Huang returns as Nvidia CEONvidia 10-Q paper gains explainedNvidia 10-Q paper gains explainedBitcoin price movement chartBitcoin price movement chartCrypto longs liquidated $645,000,000Crypto longs liquidated $645,000,000Bitcoin BTC crash under $66,000Bitcoin BTC crash under $66,000Bitcoin U.S. Dollar crash4Bitcoin U.S. Dollar crashBitcoin crash $67,000Bitcoin crash $67,000Kalshi FAA grounding betting marketsKalshi FAA grounding betting markets