iFANN
    ابحث في iFANN...
    تسجيل الدخول
    الرئيسية
    الأخبار
    فيديوهات
    صور
    صور GIF
    استكشاف
    استطلاعات
    الجوائز
    iFAMOUS
    ويكي
    أنمي
    غرف
    الإشعارات
    الرسائل
    المحفوظات
    الملف الشخصي
    ويكيالجوائزiFAMOUSالتصنيفاتالقطاعاتمكافآت المبدعينمكافآت المستخدمينالشروطالخصوصيةإرشادات المجتمعالإزالة / DMCAالمساعدةالمطورون

    © 2026 iFANN

    الرئيسية
    بحث
    الرسائل
    التنبيهات
    الملف الشخصي
    صورة
    Nate
    Nate@nate_5122w
    💭Tech💭AI🎮Visual Studio Code
    @Jolliai IDE dashboard

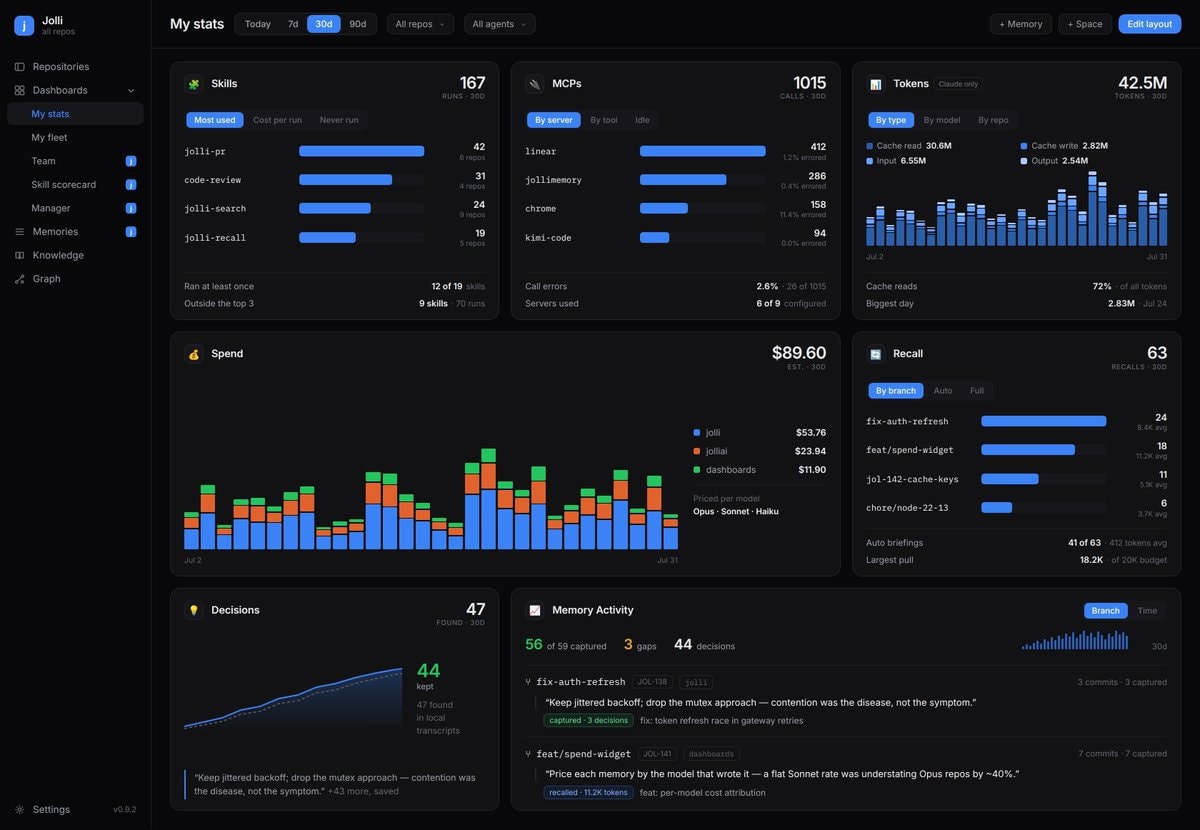
    @nate_512just dropped a privacy-first dashboard built specifically for agent workflows, and it plugs straight into your IDE instead of forcing context switches. Tracking AI spend usually means leaving your editor to check provider consoles, but Jolli reads local session history to generate analytics right where you code. The tool displays usage data in the native environment so you can access it via VS Code command palette or call it directly from Claude Code or Cursor without breaking flow. It automatically scans local session history and stores everything in a local SQLite database so your data stays on your machine unless syncing is explicitly enabled. I rarely get excited about analytics tools, but this actually keeps users focused by eliminating the need to jump between windows.

    عرض المنشور الأصلي
    @Jolliai IDE dashboard

    صورة بواسطة @nate_512· Sep 5, 2026· Tech

    عن هذه الصورة

    The image is a screenshot of a dark-themed dashboard interface. The focus is on various statistics and metrics related to a system or application, presented in a clean, data-driven style. The dashboard displays sections for "Skills," "MCPs," "Tokens," "Spend," "Recall," and "Decisions," each with charts, graphs, and numerical data. Notable elements include bar charts showing usage and cost, stacked bar charts illustrating spending over time, and lists of recent activities or decisions. The overall mood is professional and analytical, typical of a software or project management tool. The top left corner shows the logo "Jolli" with "all repos" underneath.

    عرض كل صور Tech

    ?

    المزيد من صور Tech

    عرض كل صور Tech
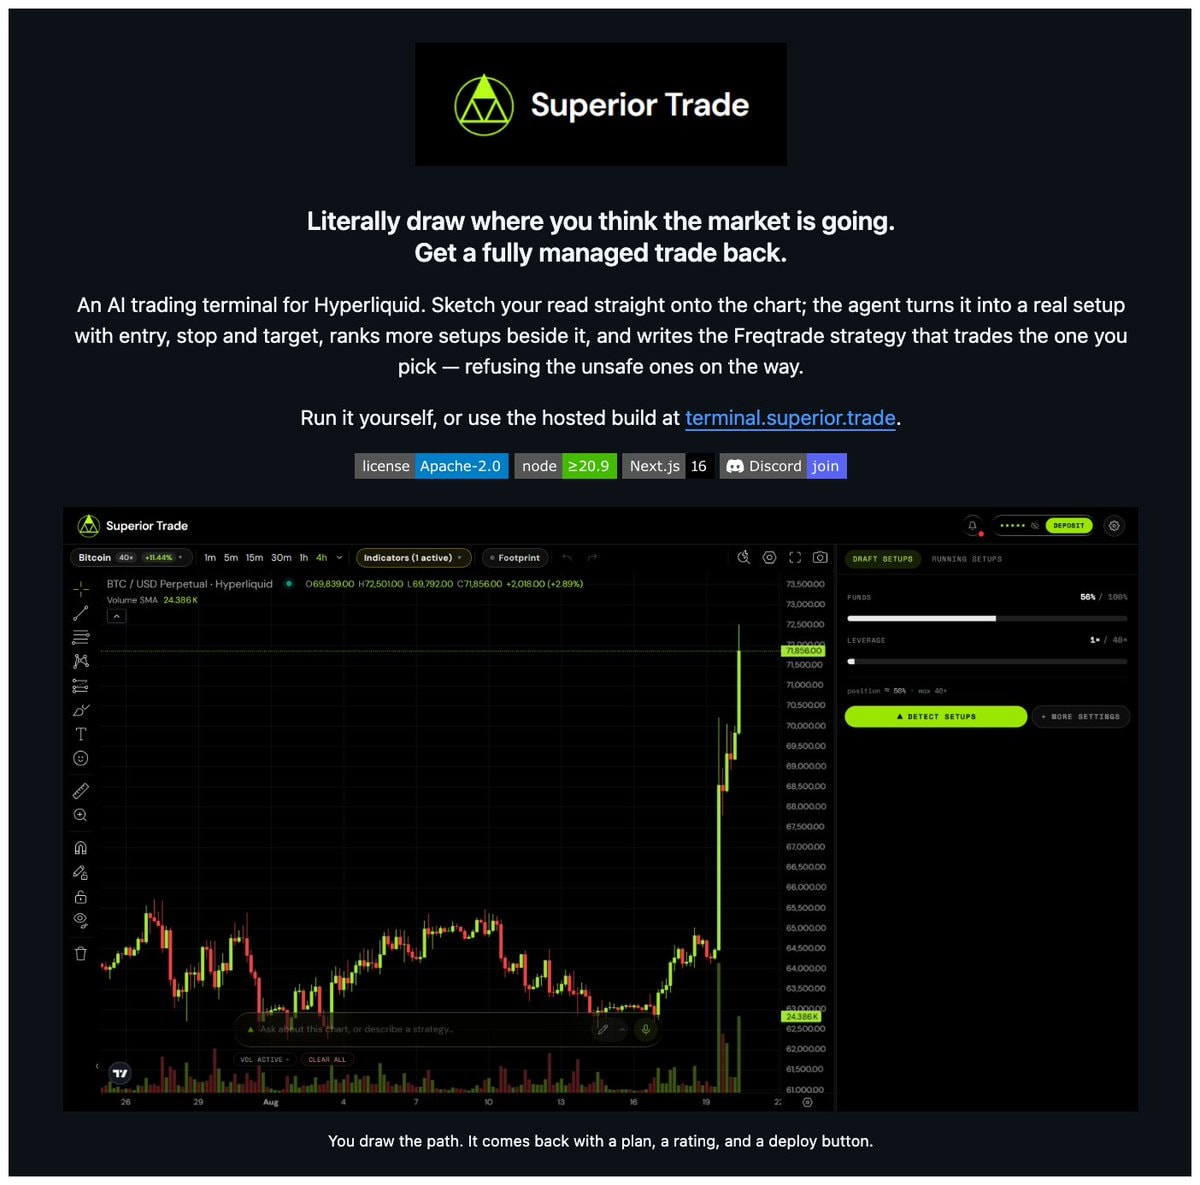
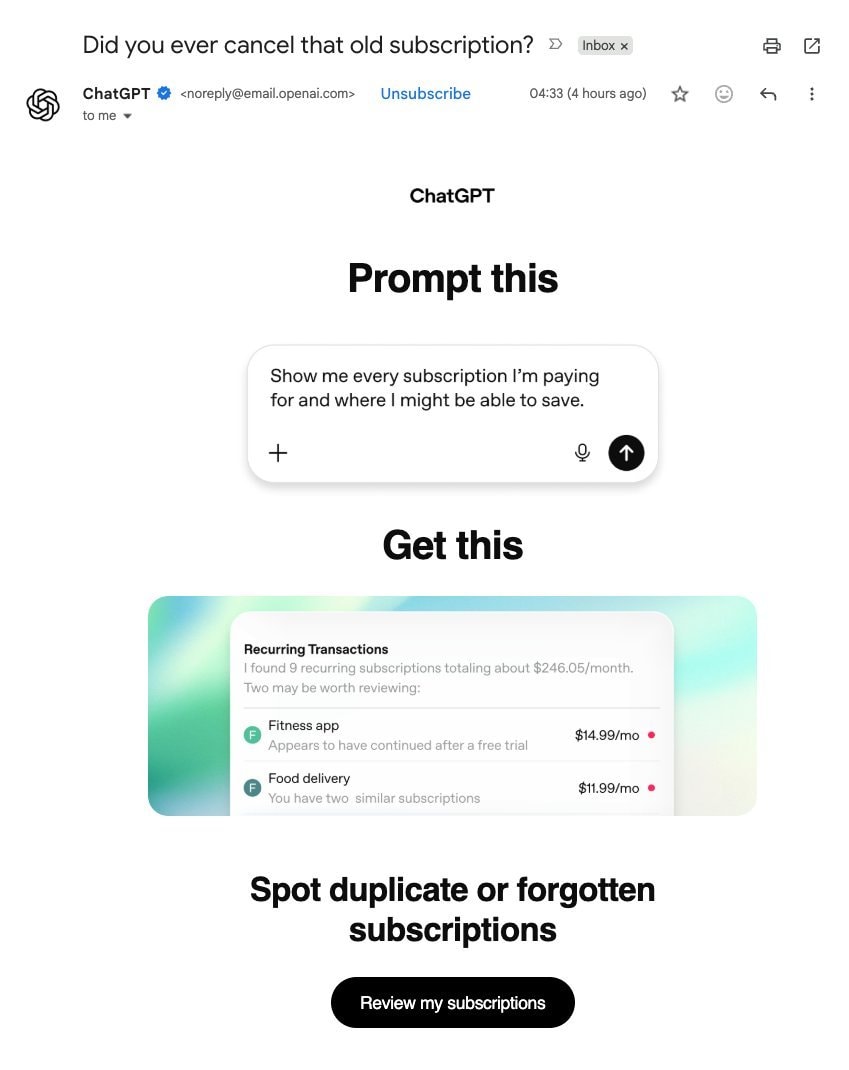
    Life of Developers infographicLife of Developers infographicSuperiorTrade Hyperliquid terminalSuperiorTrade Hyperliquid terminalChatGPT email screenshotChatGPT email screenshotHulk meme formatHulk meme formatVibe Coding vs Vibe Debugging memeVibe Coding vs Vibe Debugging memeWill Smith futuristic gun robotsWill Smith futuristic gun robotsTravis Scott RHYNO Spotify debut2Travis Scott RHYNO Spotify debut20 JEV Tips for Machine Decision Models20 JEV Tips for Machine Decision ModelsElon Musk Uranus joke theoryElon Musk Uranus joke theorythv collagethv collageNick Bostrom on machine intelligenceNick Bostrom on machine intelligenceElon Musk X usage recordsElon Musk X usage recordsAudio app beats ChatGPT to #2Audio app beats ChatGPT to #2Apple executive on iPhone durabilityApple executive on iPhone durabilitySecret internet life and Pocket FM milestoneSecret internet life and Pocket FM milestoneGoogle Gemini security breach alertGoogle Gemini security breach alertPS4 console updatePS4 console updateGoogle Astra policy reactionGoogle Astra policy reaction
    صورة
    Nate
    Nate@nate_5122w
    💭Tech💭AI🎮Visual Studio Code
    @Jolliai IDE dashboard

    @nate_512just dropped a privacy-first dashboard built specifically for agent workflows, and it plugs straight into your IDE instead of forcing context switches. Tracking AI spend usually means leaving your editor to check provider consoles, but Jolli reads local session history to generate analytics right where you code. The tool displays usage data in the native environment so you can access it via VS Code command palette or call it directly from Claude Code or Cursor without breaking flow. It automatically scans local session history and stores everything in a local SQLite database so your data stays on your machine unless syncing is explicitly enabled. I rarely get excited about analytics tools, but this actually keeps users focused by eliminating the need to jump between windows.

    عرض المنشور الأصلي
    @Jolliai IDE dashboard

    صورة بواسطة @nate_512· Sep 5, 2026· Tech

    عن هذه الصورة

    The image is a screenshot of a dark-themed dashboard interface. The focus is on various statistics and metrics related to a system or application, presented in a clean, data-driven style. The dashboard displays sections for "Skills," "MCPs," "Tokens," "Spend," "Recall," and "Decisions," each with charts, graphs, and numerical data. Notable elements include bar charts showing usage and cost, stacked bar charts illustrating spending over time, and lists of recent activities or decisions. The overall mood is professional and analytical, typical of a software or project management tool. The top left corner shows the logo "Jolli" with "all repos" underneath.

    عرض كل صور Tech

    ?

    المزيد من صور Tech

    عرض كل صور Tech
    Life of Developers infographicLife of Developers infographicSuperiorTrade Hyperliquid terminalSuperiorTrade Hyperliquid terminalChatGPT email screenshotChatGPT email screenshotHulk meme formatHulk meme formatVibe Coding vs Vibe Debugging memeVibe Coding vs Vibe Debugging memeWill Smith futuristic gun robotsWill Smith futuristic gun robotsTravis Scott RHYNO Spotify debut2Travis Scott RHYNO Spotify debut20 JEV Tips for Machine Decision Models20 JEV Tips for Machine Decision ModelsElon Musk Uranus joke theoryElon Musk Uranus joke theorythv collagethv collageNick Bostrom on machine intelligenceNick Bostrom on machine intelligenceElon Musk X usage recordsElon Musk X usage recordsAudio app beats ChatGPT to #2Audio app beats ChatGPT to #2Apple executive on iPhone durabilityApple executive on iPhone durabilitySecret internet life and Pocket FM milestoneSecret internet life and Pocket FM milestoneGoogle Gemini security breach alertGoogle Gemini security breach alertPS4 console updatePS4 console updateGoogle Astra policy reactionGoogle Astra policy reaction