iFANN
    ابحث في iFANN...
    تسجيل الدخول
    الرئيسية
    الأخبار
    فيديوهات
    الكتب
    صور
    صور GIF
    استكشاف
    استطلاعات
    الجوائز
    iFAMOUS
    ويكي
    أنمي
    غرف
    الإشعارات
    الرسائل
    المحفوظات
    الملف الشخصي
    ويكيالجوائزiFAMOUSالتصنيفاتالقطاعاتمكافآت المبدعينمكافآت المستخدمينالشروطالخصوصيةإرشادات المجتمعالإزالة / DMCAالمساعدةالمطورون

    © 2026 iFANN

    الرئيسية
    بحث
    الرسائل
    التنبيهات
    الملف الشخصي
    صورة
    Tyler Dublin
    Tyler Dublin@tyler_dublin1mo
    📱Brent Crude Oil💭Finance💭Investing
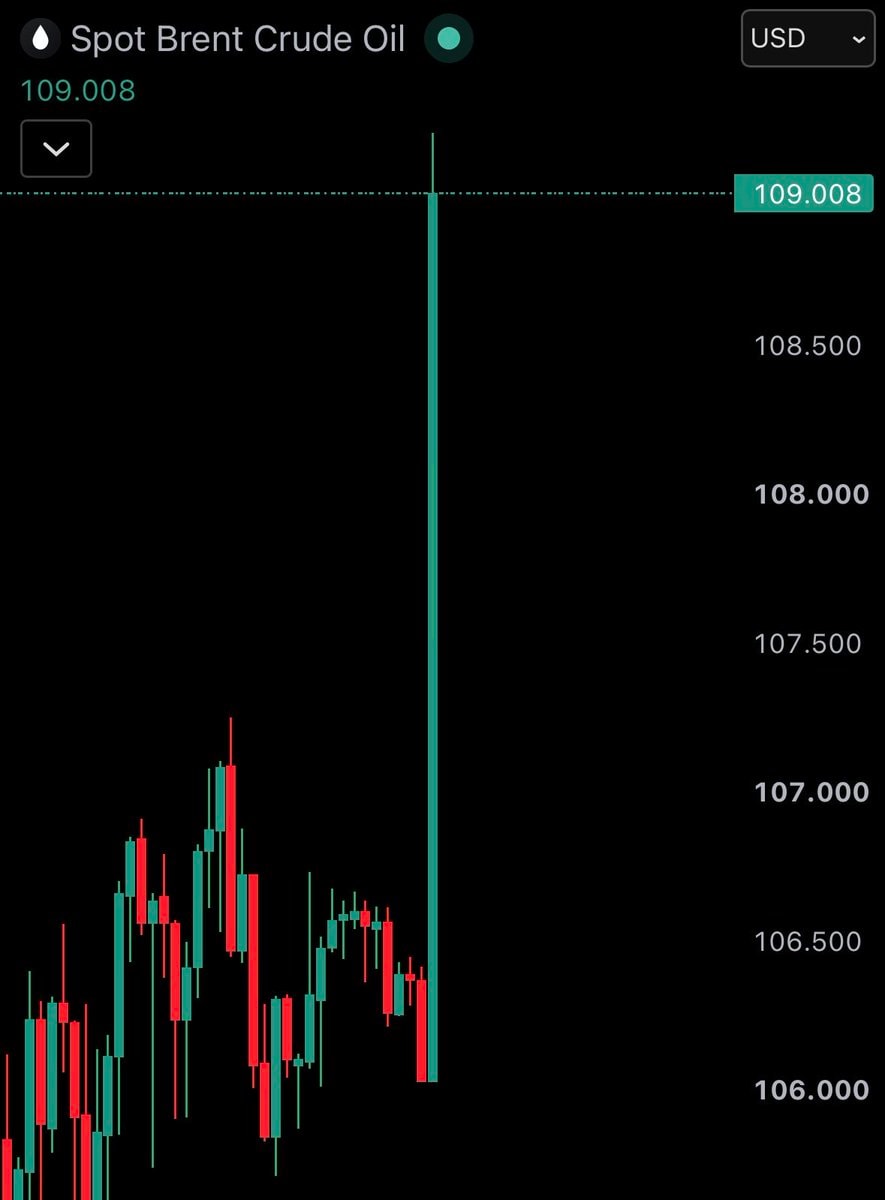
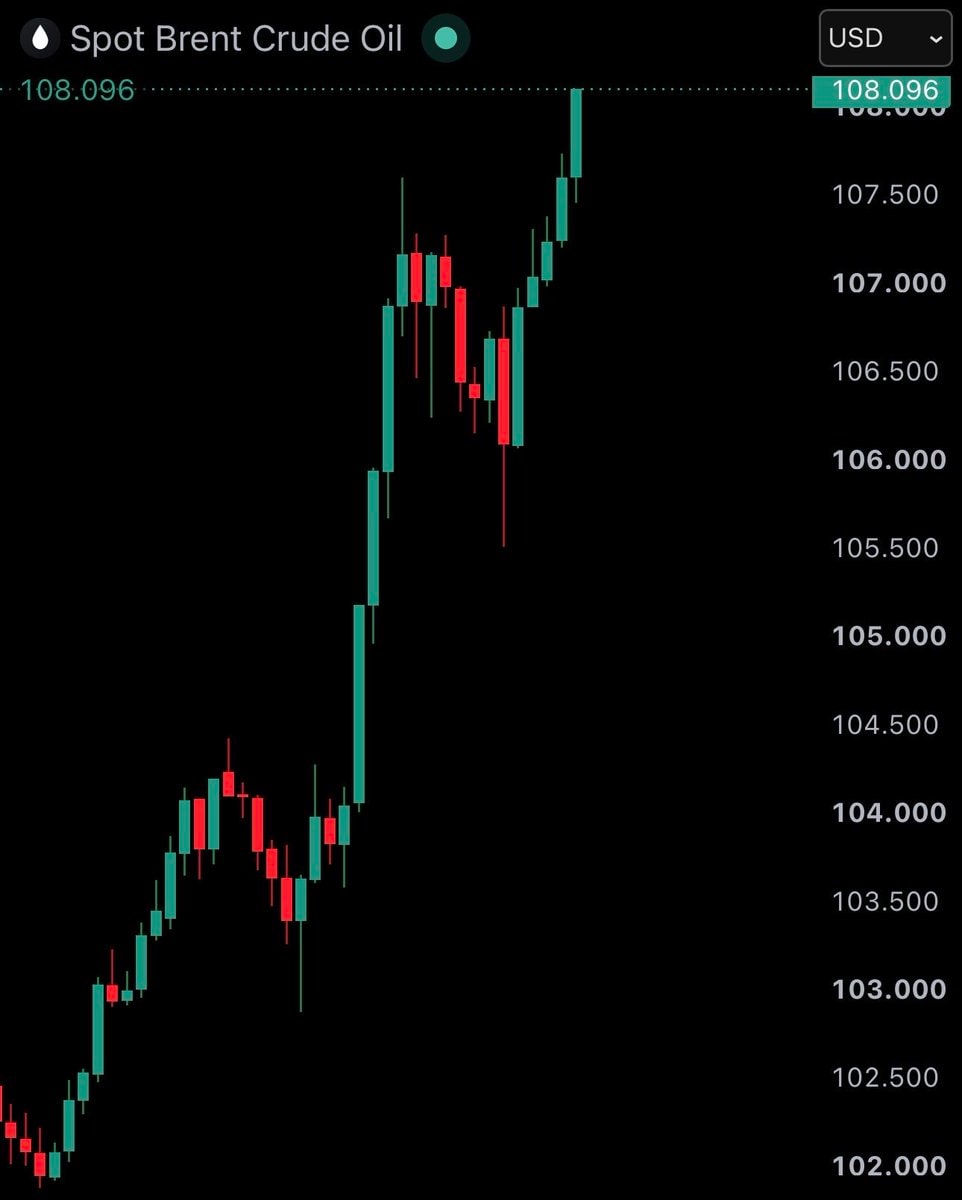
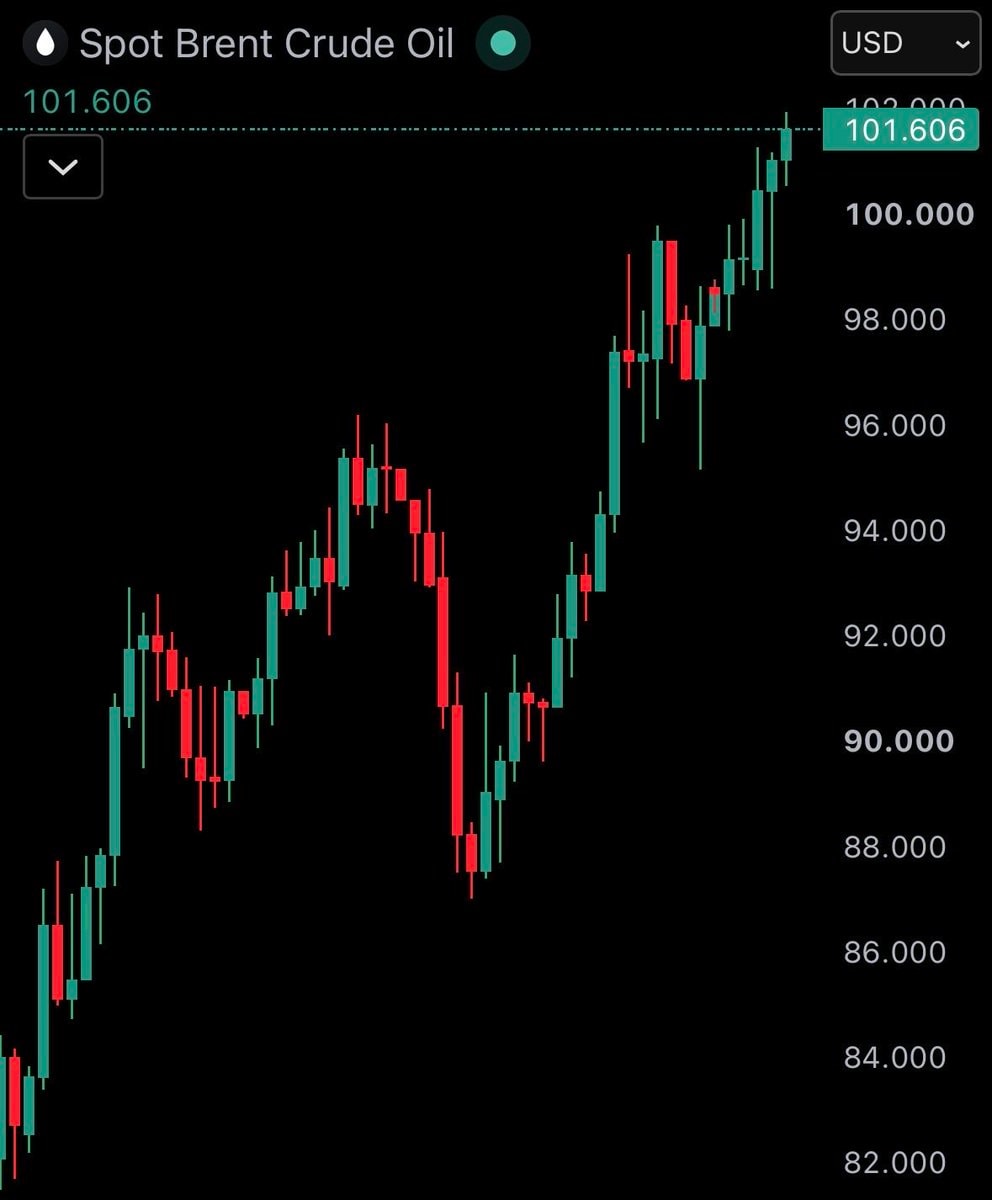
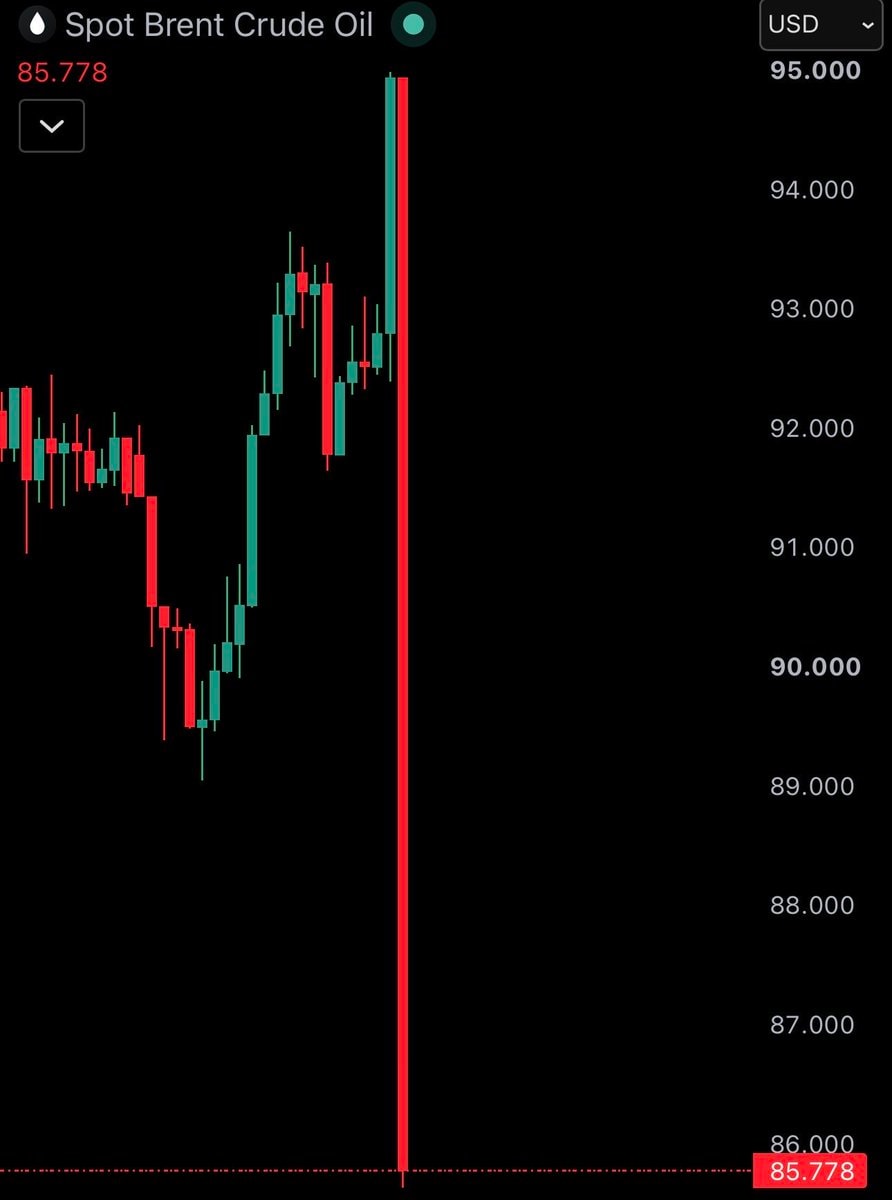
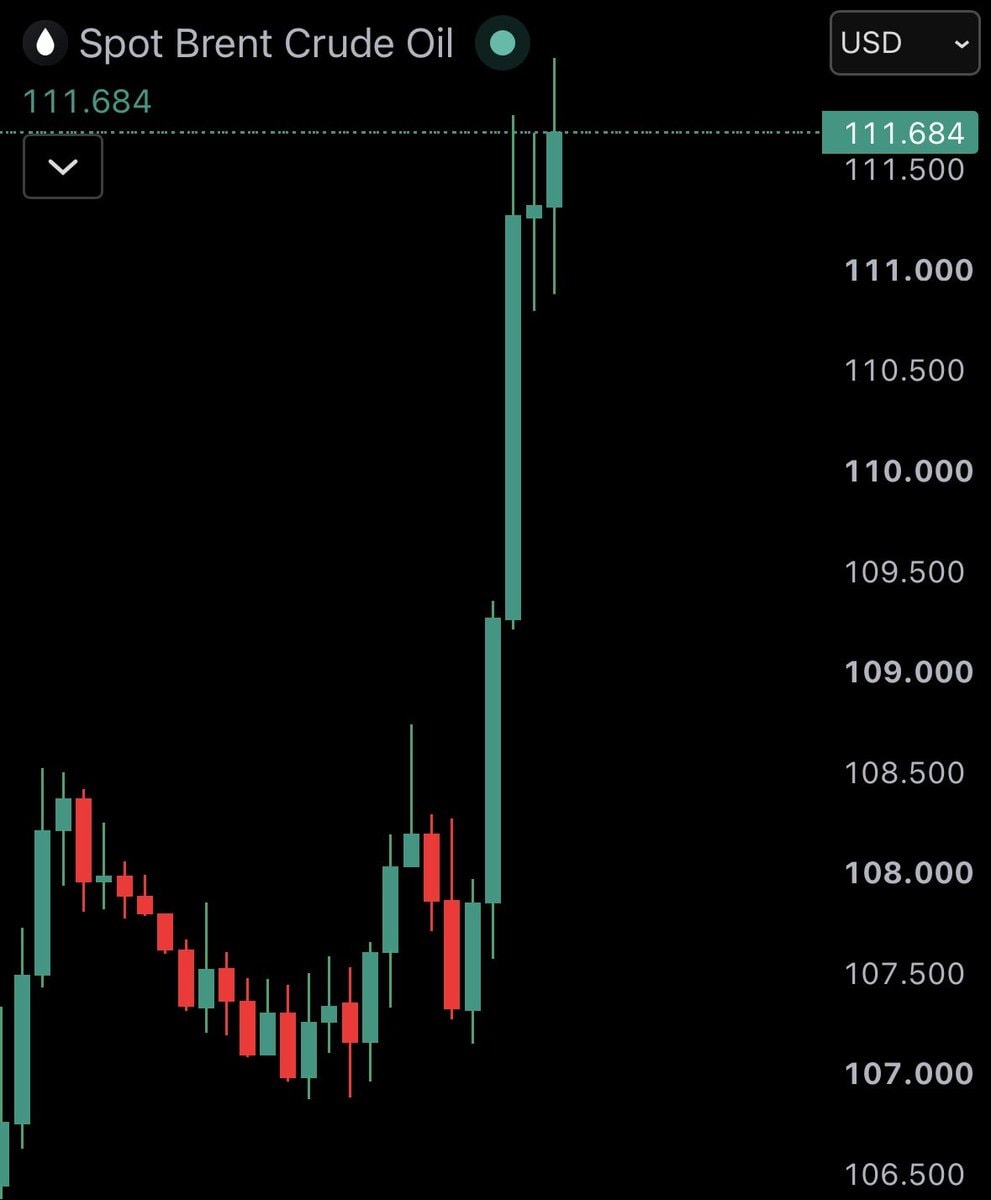
    Brent crude oil price chart

    @tyler_dublinBrent crude oil prices have risen above $111. wild though

    عرض المنشور الأصلي

    Brent crude oil price chart

    صورة بواسطة @tyler_dublin· Oct 17, 2026· Brent Crude Oil

    عن هذه الصورة

    The focus is a financial chart displaying the price of Spot Brent Crude Oil. The chart shows a steep upward trend with green and red candlesticks against a black background. The mood is analytical and informative, typical of financial data presentation. A notable detail is the sharp spike in the price, indicating significant volatility. ON-SCREEN TEXT: Spot Brent Crude Oil 111.684 USD 111.684 111.500 111.000 110.500 110.000 109.500 109.000 108.500 108.000 107.500 107.000 106.500
    عرض كل صور Brent Crude Oilاقرأ ويكي Brent Crude Oil

    ?

    المزيد من صور Brent Crude Oil

    عرض كل صور Brent Crude Oil
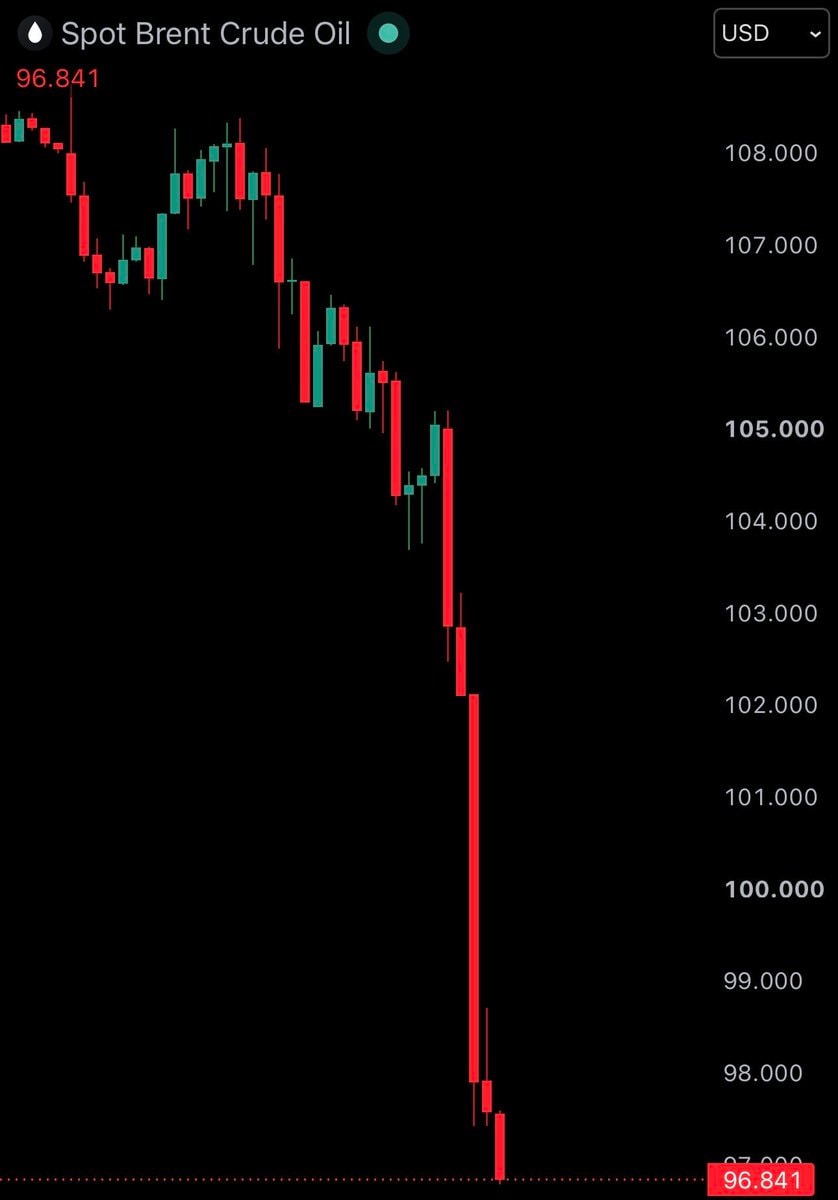
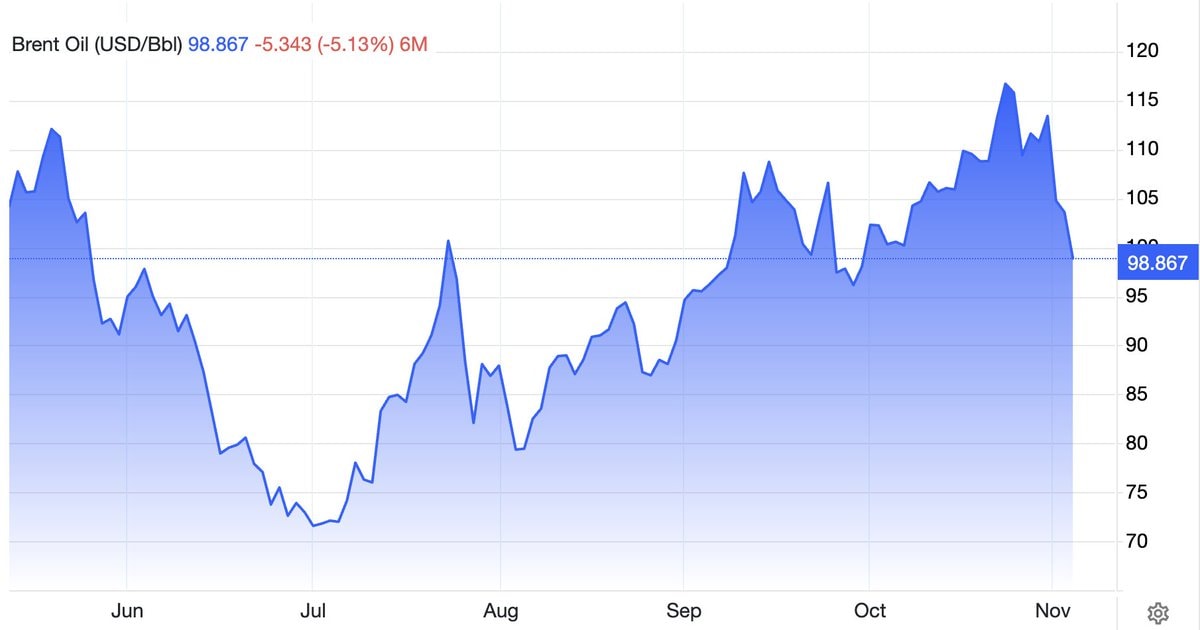
    Brent crude oil chartBrent crude oil chartBrent crude price chartBrent crude price chartBrent Crude Oil price dropBrent Crude Oil price dropBrent crude oil price surgeBrent crude oil price surgeBrent Crude Oil price chartBrent Crude Oil price chartBrent crude oil price chartBrent crude oil price chartBrent Crude Oil 10% drop after US Iran haltBrent Crude Oil 10% drop after US Iran haltBrent crude oil falls to $752Brent crude oil falls to $75
    صورة
    Tyler Dublin
    Tyler Dublin@tyler_dublin1mo
    📱Brent Crude Oil💭Finance💭Investing
    Brent crude oil price chart

    @tyler_dublinBrent crude oil prices have risen above $111. wild though

    عرض المنشور الأصلي

    Brent crude oil price chart

    صورة بواسطة @tyler_dublin· Oct 17, 2026· Brent Crude Oil

    عن هذه الصورة

    The focus is a financial chart displaying the price of Spot Brent Crude Oil. The chart shows a steep upward trend with green and red candlesticks against a black background. The mood is analytical and informative, typical of financial data presentation. A notable detail is the sharp spike in the price, indicating significant volatility. ON-SCREEN TEXT: Spot Brent Crude Oil 111.684 USD 111.684 111.500 111.000 110.500 110.000 109.500 109.000 108.500 108.000 107.500 107.000 106.500
    عرض كل صور Brent Crude Oilاقرأ ويكي Brent Crude Oil

    ?

    المزيد من صور Brent Crude Oil

    عرض كل صور Brent Crude Oil
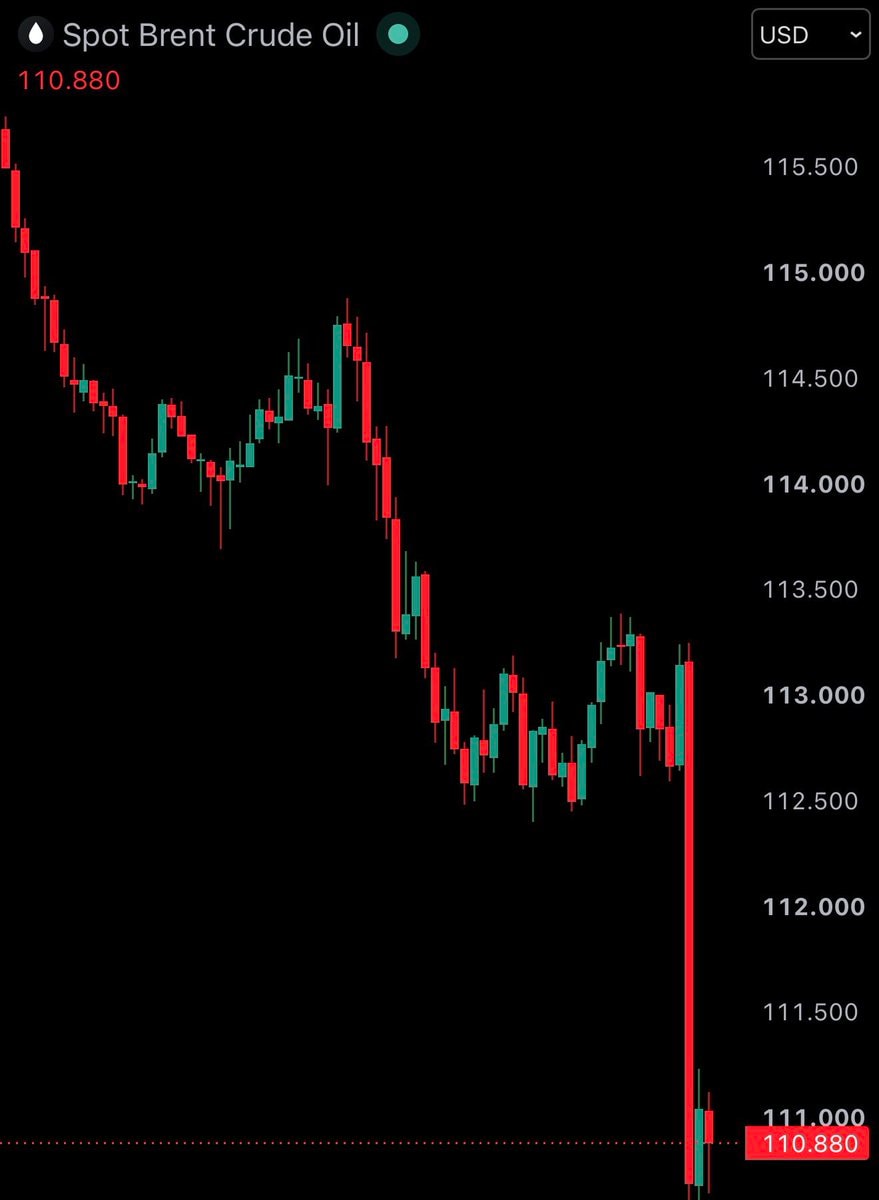
    Brent crude oil chartBrent crude oil chartBrent crude price chartBrent crude price chartBrent Crude Oil price dropBrent Crude Oil price dropBrent crude oil price surgeBrent crude oil price surgeBrent Crude Oil price chartBrent Crude Oil price chartBrent crude oil price chartBrent crude oil price chartBrent Crude Oil 10% drop after US Iran haltBrent Crude Oil 10% drop after US Iran haltBrent crude oil falls to $752Brent crude oil falls to $75